Often used SSIS expressions

Source: http://microsoft-ssis.blogspot.de/2011/06/often-used-ssis-expressions.html

Often used SSIS expressions

 
Here is a list of often used SSIS expression which I will expand regularly. You can leave your own handy expression in the comments. Or let me know if you have a better or alternative expression for the expressions below.

And because the expression builder of SSIS is quite worthless, the opensource addon SSIS Expression Editor & Tester could be very useful.


Strings

Filename from pathstring
This expression reverses the string to find the position of the last \ and uses that number (minus 1) in the Right expression:
  • RIGHT([FilePath],FINDSTRING(REVERSE([FilePath]),”\\”,1) – 1)
  • RIGHT(@[User::FilePath],FINDSTRING(REVERSE(@[User::FilePath]),”\\”,1) – 1)
 

Default value for an empty string
If you want to give a default value for empty columns, you can check the length or you can check for NULL or you can even check both:

  • LEN([STRING_COLUMN]) == 0 ? “default value” : [STRING_COLUMN]
  • ISNULL([STRING_COLUMN]) ? “default value” : [STRING_COLUMN]
  • ISNULL([STRING_COLUMN]) || LEN([STRING_COLUMN]) == 0 ? “default” : [STRING_COLUMN]

Numbers
Leading zeros
These two expression will add up to 5 leading zeros to a number. So “123” becomes “00123”:

  • RIGHT((“00000” + [STRING_COLUMN]), 5)
  • REPLICATE(“0”, 5 – LEN([STRING_COLUMN])) + [STRING_COLUMN]

Note: you will have to convert a numeric field to string field first with DT_WSTR or DT_STR.


Datetimes
Date from datetime
If you want to remove the time element in a datetime object, you should cast it to DT_DBDATE. But because that datatype is very inconvenient to use, you should cast it back to the original datatype. That will set the time to 0:00.

  • (DT_DATE)(DT_DBDATE)@[User::datetimeVariable]
  • (DT_DATE)(DT_DBDATE)[datetimeColumn]
  • (DT_DBTIMESTAMP)(DT_DBDATE)GETDATE()

Time from datetime
If you want to remove the date element in a datetime object, you should cast it to DT_DBTIME. And optional cast it to a string.

  • (DT_STR,8,1252)(DT_DBTIME)@[User::datetimeVariable]
  • (DT_STR,8,1252)(DT_DBTIME)[datetimeColumn]
  • (DT_STR,8,1252)(DT_DBTIME)GETDATE()


First day of the current month
If you want to get the first day of the current month, you take the current datetime and deduct the current day number (minus 1). Optional you can remove the time part:

  • DATEADD(“d”, -DAY(GETDATE()) + 1, GETDATE())
  • (DT_DBTIMESTAMP)(DT_DBDATE)DATEADD(“d”, -DAY(GETDATE()) + 1, GETDATE())

Last dat of the current month
If you want to get the last day of the current month, you add 1 month and deduct the current day number. Optional you can remove the time part:

  • DATEADD(“d”, -DAY(GETDATE()), DATEADD(“m”, 1, GETDATE()))
  • (DT_DBTIMESTAMP)(DT_DBDATE)DATEADD(“d”, -DAY(GETDATE()), DATEADD(“m”, 1, GETDATE()))

And if you realy want the last second of the current month 30-06-2011 23:59:59

  • DATEADD(“s”, -1,DATEADD(“d”, -DAY(GETDATE()) + 1, DATEADD(“m”, 1, (DT_DBTIMESTAMP)(DT_DBDATE)GETDATE())))

Weeknumber of the month (see)
1-june-2012 is weeknumber 23 in the year, but weeknumber 1 of the month june 2012.

  • (DATEPART(“ww”,[YourDate]) – DATEPART(“ww”,DATEADD(“d”, -DAY([YourDate]) + 1, [YourDate]))) +1

Date Expressions in SSIS

Date Expressions in SSIS

change text size: A A A

posted 11/3/2009  by AdamJorgensen –  Views: [10976] 

There are many different ways to manipulate dates when working with them in SSIS. Many great examples have been posted across the web and I use many of them on a regular basis in my coding. It can be difficult however to get a single source for many of these since many of us use the ones we need and move on.

This blog entry (and follow ups) will highlight the most useful date strip/manipulation expressions on the web and link back to their creator/publisher.

Let’s dive in !

This wiki over at SQLIS.com does a great job of collecting some of these date scripts. There is also an article published by Darren Green with most of the items in the WIKI. The Wiki is here: http://wiki.sqlis.com/default.aspx/SQLISWiki/ExpressionDateFunctions.html

My goal in this posting is to highlight some cool expressions and encourage you to get engaged and post some of your own.

Some of the coolest and most useful expressions on the WIKI include:

Removing Time from Date:

This is very useful especially when data is coming from non Microsoft systems and has full datetime values everywhere. You may need to do lookups in your ETL against a date dimension and will need to perform this task routinely.

Two good approaches are shown below:

(DT_DATE)(DT_DBDATE)@[User::WorkingDate]

OR

DATEADD(“day”,DATEDIFF(“day”,(DT_DBTIMESTAMP)0,GETDATE()),(DT_DBTIMESTAMP)0)

Calculating the beginning and end of the previous month:

Beginning of the Month:

This expression moves three months back from today, subtracting the day count from the current day of month to get the first day of the month. Then it converts the expression to a DT_DBDATE type and then back to a DT_Date to reset the time to 00:00AM.

(DT_DATE)(DT_DBDATE)DATEADD(“dd”,-1 * (DAY(GETDATE())-1),DATEADD(“month”,-3,GETDATE()))

End of the Month:

This employs similar logic in reverse, going back to the last day of the preceding month, and then does some data conversions to truncate the time to 00:00AM.

DATEADD(“mi”,-1,(DT_DATE)(DT_DBDATE) DATEADD(“dd”,0,DATEADD(“dd”,-1 * (DAY(GETDATE())-1),DATEADD(“month”,-2,GETDATE()))))

If you have an expression (date or otherwise) that makes your life better or development faster, please post it here or email me and I will get it posted with your credits ! 🙂

Don’t forget to post your thoughts or email me your questions to ajorgensen@pragmaticworks.com. As always, this Blog is to help you better understand the tools at your disposal …

Querying SSAS Cube with MDX from SSIS


Originally from http://bisherryli.wordpress.com/2012/08/14/ssis-113-querying-ssas-cube-with-mdx-from-ssis/

I worked on a SSIS package a few months back to retrieve data from a SSAS cube with MDX queries. A co-worker recently is developing a SSIS package to perform a similar task, but couldn’t get the SSIS package to work. The data flow was lost somewhere and the package could never finish the data loading.

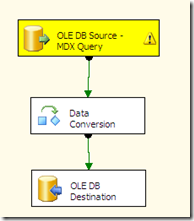
This is what it will look like in the Data Flow task. The OLE DB Source will stay yellow forever.

image

I couldn’t remember right away how my SSIS package was configured to make the data flow work. I had to find my old SSIS package and open it to refresh my memory.

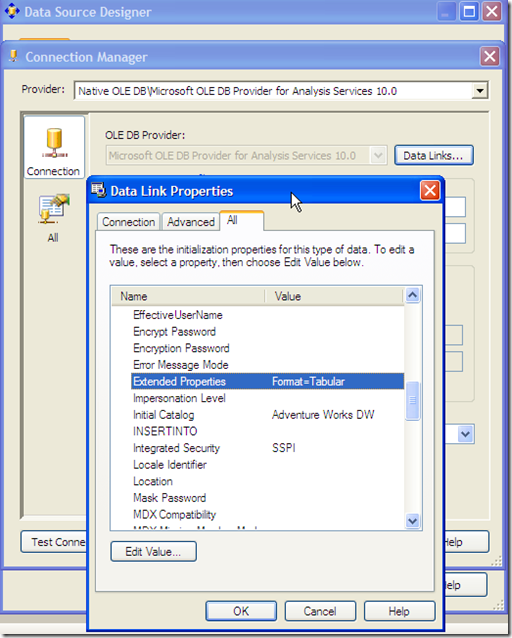
Need to set Format=Tabular in the Data Link Extended Properties

After choosing the OLE DB Provider for Analysis Services 10.0 as the provider for the connection manager, we need to go to the All tab to set Format=Tabular in the Data Link Extended Properties.

image

There are many blogs on this little “secret” developers discovered. Some claimed that this is a fix for a bug in SSIS 2005 SP1. I had to do this in both SSIS 2005 and 2008 to make it work. So I am not sure if it is caused by a bug or a designed “feature” in SSIS.

Neither can I find more information about what this property value means. You are welcome to share if you have more insight on this.

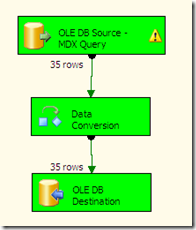
The happy green color is what you will see once you set Format=Tabular in the Data Link Extended Properties.

image

A couple of notes:

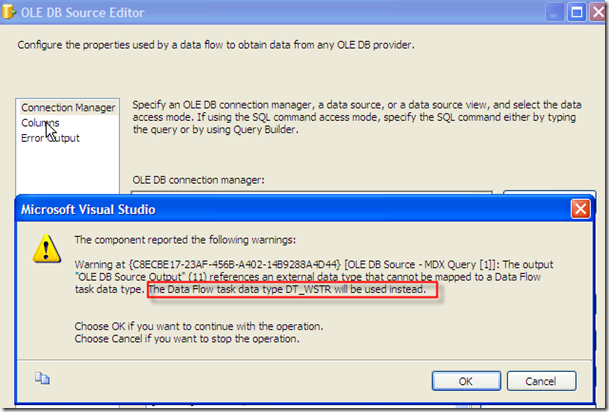
1. About the data type. Whenever you try to access the column information, you will get a “nice” warning from SSIS that data type DT_WSTR (nvarchar) will be used instead. Again if you have more insight on this, you are welcome to share.

image

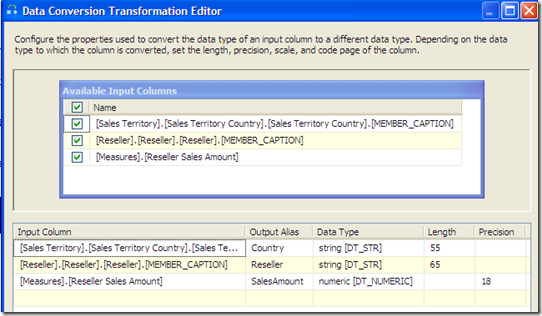
2. I used a Data Conversion transformation to convert the DT_WSTR to DT_STR or DT_NUMERIC accordingly.

image

Integrate WordPress Into Existing Site Tutorial


Integrate WordPress Into Existing Site Tutorial

Add Your Rating:

9 votes, average: 4.33 out of 59 votes, average: 4.33 out of 59 votes, average: 4.33 out of 59 votes, average: 4.33 out of 59 votes, average: 4.33 out of 5 (9 votes, average: 4.33 out of 5, rated)

Posted on October 23, 2009 by Chris Burns

*update 12/28/2010 – We have posted an updated video for 2011 using the TwentyTen theme on WordPress newer version. It is much more detailed and shows more info on how to properly integrate WordPress into any existing website you may have. View it here:http://www.websitedesign411.com/blog/integrate-wordpress-using-twentyten-2011/

Many of our readers have requested that we provide a detailed write up of how to integrate a WordPress blog into any existing website. We are going to show you step by step how to get a working WordPress installation seamlessly integrated into your current website. It doesn’t matter if you are using Joomla, Drupal, or straight HTML, this write up will work for your website too!

Okay lets start by talking about some preparations you need to make. We need to make sure that you have installed WordPress on your host. For the purposes of this tutorial we will install WordPress under the /blog directory. So we are clear your WordPress installation should be found at http://www.yourwebsite.com/blog. This should be a standard WordPress install, nothing special is required from the installation standpoint.

Once you can see the default WordPress blog on your site at http://www.yourwebsite.com/blog, then we can begin the customization, excited yet?

default WordPress Blog

wordpress ftp filesFirst thing we want to do is log into the admin area and make sure you have the WordPress theme set to the default theme. Now pull down all the .PHP files we are going to edit from the host. Navigate through your favorite FTP program to the following location: /yourwebsite.com/blog/wp-content/themes/default/. From here you will want to move the following file to your desktop (or whichever folder you will use to house the files while you edit them):

  • header.php
  • index.php
  • footer.php
  • single.php
  • comments.php

Now lets make sure you have a page setup on your site for the blog. This will be the “template” page you will use during your customization. If using HTML just make sure you have a page that you can actually visit for the blog at http://www.yoursite.com/blog. Leave the space where the blog content will go empty except for the text “blog content here”. Also make sure you have a space for your sidebar and write the text “sidebar here” so you can find it later as we edit the WordPress theme with this template. Below is a graphic example of what the blog “template” page could look like:

blog template page

Now right click on your template page and view the source. From the view source page press Control+A to highlight all the text. Now press Control+C to copy the text. Open up a blank HTML file in your HTML/PHP editor (we will use Dreamweaver from now on for this tutorial). Go to the code page of your editor and delete everything so you have a blank canvass. Now press Control+V to paste the details of your template page into this new document.

EDIT THE HEADER.PHP FILE

1. Open up the header.php file in Dreamweaver. In the code you will want to delete everything after the initial

<?php /** * @package WordPress *@subpackage Default_Theme */ ?>

Use the screen shot below if your unsure:

blog template page

2. Now go to your template you copied earlier and view the source. You should copy everything over exactly as it is. Start at the top and copy everything down to the area just before where your main body content for the blog will start. This will vary depending on your particular website layout, but it will work regardless. Once you have copied everything you consider to be the “header” from your template paste it into the header.php file. You can delete the title meta tag you copied from your template and replace with the the following one that you can find in the original header file:

<title><?php wp_title(‘&laquo;’, true, ‘right’); ?> <?php bloginfo(‘name’); ?></title>

In addition you can paste the following code from the original header.php code and place it in the meta area of your copied template code:

<link rel=”pingback” href=”<?php bloginfo(‘pingback_url’); ?>” />

3. Since the blog is located in a sub directory we highly recommend making sure you input the full URL address to the files specified in all the meta tag info of your header.php file. For example

<link rel=”pingback” href=”<?php bloginfo(‘pingback_url’); ?>” />

would become

<link rel=”pingback” href=”http://www.burnseo.com/blog/xmlrpc.php” />

Once you have done this for all the meta URL’s, you can save this file and transfer it to your host Copy over the header.php file in the default theme folder we discussed earlier.

EDIT THE INDEX.PHP FILE

1. Open the index.php file and delete everything after the inital PHP call for the header (leave that intact). Go back to your template code and copy EVERYTHING directly after the header area you copied ealier and UP TO the footer. Take this code and paste into the index.php file after the initial PHP header call. Now search your new index.php file and find the content filler text on your template that we suggest earlier. We used the text “blog content here”. Find that text and in it’s place paste the following code:

<?php if (have_posts()) : ?>

<?php while (have_posts()) : the_post(); ?>

<div <?php post_class() ?> id=”post-<?php the_ID(); ?>”>
<h2><a href=”<?php the_permalink() ?>” rel=”bookmark” title=”Permanent Link to <?php the_title_attribute(); ?>”><?php the_title(); ?></a></h2>
<small><?php the_time(‘F jS, Y’) ?> <!– by <?php the_author() ?> –></small>

<div>
<?php the_content(‘Read the rest of this entry &raquo;’); ?>
</div>

<p><?php the_tags(‘Tags: ‘, ‘, ‘, ‘<br />’); ?> Posted in <?php the_category(‘, ‘) ?> | <?php edit_post_link(‘Edit’, ”, ‘ | ‘); ?> <?php comments_popup_link(‘No Comments »’, ’1 Comment »’, ‘% Comments »’); ?></p>
</div>

<?php endwhile; ?>

<div>
<div><?php next_posts_link(‘&laquo; Older Entries’) ?></div>
<div><?php previous_posts_link(‘Newer Entries &raquo;’) ?></div>
</div>

<?php else : ?>

<h2>Not Found</h2>
<p>Sorry, but you are looking for something that isn’t here.</p>
<?php get_search_form(); ?>

<?php endif; ?>

Good job your almost halfway done!

2. Now make sure you go to the very end of the code of the index.php file and paste the following code as the LAST LINE OF CODE for the index.php file:

<?php get_footer(); ?>

3. The last thing you will have to do with the index.php file is find the filler text you used for your sidebar. Remember that we used the text “sidebar here”. Find that text and in it’s place past the following code:

<?php get_sidebar(); ?>

you might have to place a div or paragraph tag around this one and center it or align it left or right depending on your taste.

EDIT THE FOOTER.PHP FILE

1. Open the footer.php file. You can delete everything AFTER the initial PHP call. Go back to your template and copy everything after your index text down to the last code on this page. Paste this code after the initial PHP call in the footer.php file. before the /body tag you will want to insert the following code:

<?php wp_footer(); ?>

if you would like to support WordPress or want to display the feed information in your footer you can paste the following code anywhere appropriate in your footer file (it’s not required to work so feel free to not include this if you don’t want to):

<?php bloginfo(‘name’); ?> is proudly powered by
<a href=”http://wordpress.org/”>WordPress</a>
<br /><a href=”<?php bloginfo(‘rss2_url’); ?>”>Entries (RSS)</a>
and <a href=”<?php bloginfo(‘comments_rss2_url’); ?>”>Comments (RSS)</a>.
<!– <?php echo get_num_queries(); ?> queries. <?php timer_stop(1); ?> seconds. –>

Okay now you have the basic blog customized to your website! you can overwrite the header.php, index.php and footer.php files in the default wordpress theme folder on your host. If you refresh the page you should see your working blog integrated with your site design! Great work, but not quite done yet…

EDIT SINGLE.PHP FILE

You want to copy everything from your new index.php into the single.php file. Highlight the WordPress code we told you to paste into the index.php file earlier and delete it. in it’s place replace it with this new code:

<?php if (have_posts()) : while (have_posts()) : the_post(); ?>

<div>
<div><?php previous_post_link(‘&laquo; %link’) ?></div>
<div><?php next_post_link(‘%link &raquo;’) ?></div>
</div>

<div <?php post_class() ?> id=”post-<?php the_ID(); ?>”>
<h2><?php the_title(); ?></h2>

<div>
<?php the_content(‘<p>Read the rest of this entry &raquo;</p>’); ?>

<?php wp_link_pages(array(‘before’ => ‘<p><strong>Pages:</strong> ‘, ‘after’ => ‘</p>’, ‘next_or_number’ => ‘number’)); ?>
<?php the_tags( ‘<p>Tags: ‘, ‘, ‘, ‘</p>’); ?>

<p>
<small>
This entry was posted
<?php /* This is commented, because it requires a little adjusting sometimes.
You’ll need to download this plugin, and follow the instructions:
http://binarybonsai.com/wordpress/time-since/ */
/* $entry_datetime = abs(strtotime($post->post_date) – (60*120)); echo time_since($entry_datetime); echo ‘ ago’; */ ?>
on <?php the_time(‘l, F jS, Y’) ?> at <?php the_time() ?>
and is filed under <?php the_category(‘, ‘) ?>.
You can follow any responses to this entry through the <?php post_comments_feed_link(‘RSS 2.0′); ?> feed.

<?php if ( comments_open() && pings_open() ) {
// Both Comments and Pings are open ?>
You can <a href=”#respond”>leave a response</a>, or <a href=”<?php trackback_url(); ?>” rel=”trackback”>trackback</a> from your own site.

<?php } elseif ( !comments_open() && pings_open() ) {
// Only Pings are Open ?>
Responses are currently closed, but you can <a href=”<?php trackback_url(); ?> ” rel=”trackback”>trackback</a> from your own site.

<?php } elseif ( comments_open() && !pings_open() ) {
// Comments are open, Pings are not ?>
You can skip to the end and leave a response. Pinging is currently not allowed.

<?php } elseif ( !comments_open() && !pings_open() ) {
// Neither Comments, nor Pings are open ?>
Both comments and pings are currently closed.

<?php } edit_post_link(‘Edit this entry’,”,’.’); ?>

</small>
</p>

</div>
</div>

<?php comments_template(); ?>

<?php endwhile; else: ?>

<p>Sorry, no posts matched your criteria.</p>

<?php endif; ?>

Keep the rest of the code in tact, you are only swapping out the main content code here. only replace the exact PHP code we told you to insert originally with this one. The last code should still be the call for the footer.php file as it is in the index.php file.

EDIT THE COMMENT.PHP FILE

Open the comment.php file and look for this line of code:

<p><textarea name=”comment” id=”comment” cols=”100%” rows=”10″ tabindex=”4″></textarea></p>

You will want to decrease the cols value to something lower than 100%. I suggest 75%-80% and see if that fits well with the site.

Now overwrite the single.php file and the comments.php file and go back and view an actual blog post on your site. It should look nice and pretty now.

At this point you have succesfully integrated a fully functional WordPress blog into your website. It now looks and functions exactly as the rest of your site does. You can go into your WordPress admin and install plugins and widgets to your hearts content!

if we missed anything or you have any other suggestions for future tutorials don’t hesistate to give us a suggestion! We welcome any feedback.

*12/02/2009 Edited the tutorial with code in the header.php that was causing a parse error. Also we highly recommend the use of SEO plugins to help with the meta tags once your blog is up and running. Happy blogging!

Read more: http://www.burnseo.com/blog/2009/10/23/integrate-wordpress-into-existing-website-tutorial/#ixzz2HmfM94R7

simple way to get information about your SQL Server jobs


There is absolutely no need to have complicated logging  or tools to get the information about your SQL Server jobs, even a simple logging is pre-installed on every SQL Server Smiley mit geöffnetem Mund

With that simple select i see all my jobs with their steps and the schedules:

use msdb


select *

FROM         dbo.sysjobs AS j INNER JOIN

                      dbo.sysjobsteps AS st ON j.job_id = st.job_id INNER JOIN

                      dbo.sysjobschedules AS s ON j.job_id = s.job_id


I believe the output is simply self-explaining


And to see the logging itself simply take this:

use msdb


select *

FROM         dbo.sysjobs AS j INNER JOIN

                      dbo.sysjobsteps AS st ON j.job_id = st.job_id INNER JOIN

                      dbo.sysjobhistory AS h ON j.job_id = h.job_id

order by run_date, run_time


Sometimes life can be easy Zwinkerndes Smiley

Dietmar

Big Data Right Now: Five Trendy Open Source Technologies

http://techcrunch.com/2012/10/27/big-data-right-now-five-trendy-open-source-technologies/


news

Comment

2

inShare145

Big Data Right Now: Five Trendy Open Source Technologies

Tim Gasper

posted yesterday

2 Comments

Screen Shot 2012-10-26 at 11.53.10 PM

Big Data is on every CIO’s mind this quarter, and for good reason. Companies will have spent $4.3 billion on Big Data technologies by the end of 2012.

But here’s where it gets interesting. Those initial investments will in turn trigger a domino effect of upgrades and new initiatives that are valued at $34 billion for 2013, per Gartner. Over a 5 year period, spend is estimated at $232 billion.

What you’re seeing right now is only the tip of a gigantic iceberg.

Big Data is presently synonymous with technologies like Hadoop, and the “NoSQL” class of databases including Mongo (document stores) and Cassandra (key-values).  Today it’s possible to stream real-time analytics with ease. Spinning clusters up and down is a (relative) cinch, accomplished in 20 minutes or less. We have table stakes.

But there are new, untapped advantages and non-trivially large opportunities beyond these usual suspects.

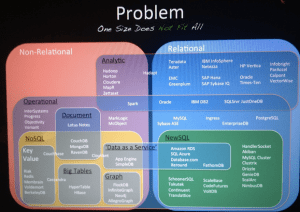
Did you know that there are over 250K viable open source technologies on the market today? Innovation is all around us. The increasing complexity of systems, in fact, looks something like this:

We have a lot of…choices, to say the least.

What’s on our own radar, and what’s coming down the pipe for Fortune 2000 companies? What new projects are the most viable candidates for production-grade usage? Which deserve your undivided attention?

We did all the research and testing so you don’t have to. Let’s look at five new technologies that are shaking things up in Big Data. Here is the newest class of tools that you can’t afford to overlook, coming soon to an enterprise near you.

Storm and Kafka

Storm and Kafka are the future of stream processing, and they are already in use at a number of high-profile companies including Groupon, Alibaba, and The Weather Channel.

Born inside of Twitter, Storm is a “distributed real-time computation system”. Storm does for real-time processing what Hadoop did for batch processing. Kafka for its part is a messaging system developed at LinkedIn to serve as the foundation for their activity stream and the data processing pipeline behind it.

When paired together, you get the stream, you get it in-real time, and you get it at linear scale.

Why should you care?

With Storm and Kafka, you can conduct stream processing at linear scale, assured that every message gets processed in real-time, reliably. In tandem, Storm and Kafka can handle data velocities of tens of thousands of messages every second.

Stream processing solutions like Storm and Kafka have caught the attention of many enterprises due to their superior approach to ETL (extract, transform, load) and data integration.

Storm and Kafka are also great at in-memory analytics, and real-time decision support. Companies are quickly realizing that batch processing in Hadoop does not support real-time business needs. Real-time streaming analytics is a must-have component in any enterprise Big Data solution or stack, because of how elegantly they handle the “three V’s” — volume, velocity and variety.

Storm and Kafka are the two technologies on the list that we’re most committed to at Infochimps, and it is reasonable to expect that they’ll be a formal part of our platform soon.

Drill and Dremel

Drill and Dremel make large-scale, ad-hoc querying of data possible, with radically lower latencies that are especially apt for data exploration. They make it possible to scan over petabytes of data in seconds, to answer ad hoc queries and presumably, power compelling visualizations.

Drill and Dremel put power in the hands of business analysts, and not just data engineers. The business side of the house will love Drill and Dremel.

Drill is the open source version of what Google is doing with Dremel (Google also offers Dremel-as-a-Service with its BigQuery offering). Companies are going to want to make the tool their own, which why Drill is the thing to watch mostly closely. Although it’s not quite there yet, strong interest by the development community is helping the tool mature rapidly.

Why should you care?

Drill and Dremel compare favorably to Hadoop for anything ad-hoc. Hadoop is all about batch processing workflows, which creates certain disadvantages.

The Hadoop ecosystem worked very hard to make MapReduce an approachable tool for ad hoc analyses. From Sawzall to Pig and Hive, many interface layers have been built on top of Hadoop to make it more friendly, and business-accessible. Yet, for all of the SQL-like familiarity, these abstraction layers ignore one fundamental reality – MapReduce (and thereby Hadoop) is purpose-built for organized data processing (read: running jobs, or “workflows”).

What if you’re not worried about running jobs? What if you’re more concerned with asking questions and getting answers — slicing and dicing, looking for insights?

That’s “ad hoc exploration” in a nutshell — if you assume data that’s been processed already, how can you optimize for speed? You shouldn’t have to run a new job and wait, sometimes for considerable lengths of time, every time you want to ask a new question.

In stark contrast to workflow-based methodology, most business-driven BI and analytics queries are fundamentally ad hoc, interactive, low-latency analyses. Writing Map Reduce workflows is prohibitive for many business analysts. Waiting minutes for jobs to start and hours for workflows to complete is not conducive to an interactive experience of data, the comparing and contrasting, and the zooming in and out that ultimately creates fundamentally new insights.

Some data scientists even speculate that Drill and Dremel may actually be better than Hadoop in the wider sense, and a potential replacement, even. That’s a little too edgy a stance to embrace right now, but there is merit in an approach to analytics that is more query-oriented and low latency.

At Infochimps we like the Elasticsearch full-text search engine and database for doing high-level data exploration, but for truly capable Big Data querying at the (relative) seat level, we think that Drill will become the de facto solution.

R

R is an open source statistical programming language. It is incredibly powerful. Over two million (and counting) analysts use R. It’s been around since 1997 if you can believe it. It is a modern version of the S language for statistical computing that originally came out of the Bell Labs. Today, R is quickly becoming the new standard for statistics.

R performs complex data science at a much smaller price (both literally and figuratively). R is making serious headway in ousting SAS and SPSS from their thrones, and has become the tool of choice for the world’s best statisticians (and data scientists, and analysts too).

Why should you care?

Because it has an unusually strong community around it, you can find R libraries for almost anything under the sun — making virtually any kind of data science capability accessible without new code. R is exciting because of who is working on it, and how much net-new innovation is happening on a daily basis. the R community is one of the most thrilling places to be in Big Data right now.

R is a also wonderful way to future-proof your Big Data program. In the last few months, literally thousands of new features have been introduced, replete with publicly available knowledge bases for every analysis type you’d want to do as an organization.

Also, R works very well with Hadoop, making it an ideal part of an integrated Big Data approach.

To keep an eye on: Julia is an interesting and growing alternative to R, because it combats R’s notoriously slow language interpreter problem. The community around Julia isn’t nearly as strong right now, but if you have a need for speed…

Gremlin and Giraph

Gremlin and Giraph help empower graph analysis, and are often used coupled with graph databases like Neo4j or InfiniteGraph, or in the case of Giraph, working with Hadoop. Golden Orb is another high-profile example of a graph-based project picking up steam.

Graph databases are pretty cutting edge. They have interesting differences with relational databases, which mean that sometimes you might want to take a graph approach rather than a relational approach from the very beginning.

The common analogue for graph-based approaches is Google’s Pregel, of which Gremlin and Giraph are open source alternatives. In fact, here’s a great read on how mimicry of Google technologies is a cottage industry unto itself.

Why should you care?

Graphs do a great job of modeling computer networks, and social networks, too — anything that links data together. Another common use is mapping, and geographic pathways — calculating shortest routes for example, from place A to place B (or to return to the social case, tracing the proximity of stated relationships from person A to person B).

Graphs are also popular for bioscience and physics use cases for this reason — they can chart molecular structures unusually well, for example.

Big picture, graph databases and analysis languages and frameworks are a great illustration of how the world is starting to realize that Big Data is not about having one database or one programming framework that accomplishes everything. Graph-based approaches are a killer app, so to speak, for anything that involves large networks with many nodes, and many linked pathways between those nodes.

The most innovative scientists and engineers know to apply the right tool for each job, making sure everything plays nice and can talk to each other (the glue in this sense becomes the core competence).

SAP Hana

SAP Hana is an in-memory analytics platform that includes an in-memory database and a suite of tools and software for creating analytical processes and moving data in and out, in the right formats.

Why should you care?

SAP is going against the grain of most entrenched enterprise mega-players by providing a very powerful open source product.  And it’s not only that — SAP is also creating meaningful incentives for startups to embrace Hana as well. They are authentically fostering community involvement and there is uniformly positive sentiment around Hana as a result.

Hana highly benefits any applications with unusually fast processing needs, such as financial modeling and decision support, website personalization, and fraud detection, among many other use cases.

The biggest drawback of Hana is that “in-memory” means that it by definition leverages access to solid state memory, which has clear advantages, but is much more expensive than conventional disk storage.

For organizations that don’t mind the added operational cost, Hana means incredible speed for very-low latency big data processing.

Honorable mention: D3

D3 doesn’t make the list quite yet, but it’s close, and worth mentioning for that reason.

D3 is a javascript document visualization library that revolutionizes how powerfully and creatively we can visualize information, and make data truly interactive. It was created by Michael Bostock and came out of his work at the New York Times, where he is the Graphics Editor.

For example, you can use D3 to generate an HTML table from an array of numbers. Or, you can use the same data to create an interactive  bar chart with smooth transitions and interaction.

Here’s an example of D3 in action, making President Obama’s 2013 budget proposal understandable, and navigable.

With D3, programmers can create dashboards galore. Organizations of all sizes are quickly embracing D3 as a superior visualization platform to the heads-up displays of yesteryear.

Editor’s note: Tim Gasper is the Product Manager at Infochimps, the #1 Big Data platform in the cloud. He leads product marketing, product development, and customer discovery. Previously, he was co-founder and CMO at Keepstream, a social media curation and analytics company that Infochimps acquired in August of 2010. You should follow him on Twitter here.

CPU and Scheduler Performance Monitoring using SQL Server and Excel

CPU and Scheduler Performance Monitoring using SQL Server and Excel

By Derek Colley, 2012/10/04

Have you ever wanted to build your own performance dashboard? This article will take you through the steps required to build a simple Excel-based monitoring solution to watch your CPU usage, SQL Server scheduler configuration, workloads and worker thread activity. At its core are filtered queries on the Dynamic Management Objects / Views (DMOs / DMVs) sys.dm_os_schedulers, sys.dm_os_sys_info and sys.dm_os_ring_buffers, and these are combined into meaningful information through the use of stored procedures, Excel graph functionality and data refresh capabilities.

This article is aimed at users of SQL Server 2005 and above. The techniques have been tested using SQL Server 2005 Standard Edition and 2012 Developer Edition, but will work equally well with SQL Server 2008 (indeed, you will probably be able to improve upon it with new features). I would also like to add that this article is fixed in scope to CPU performance, workers and schedulers. You will be able to add more functionality such as memory use monitoring, I/O performance and more. To this end I heartily recommend Microsoft’s SQL Server 2008 Internals and Wrox’s SQL Server 2008 Internals & Troubleshooting, which have a place of pride on my shelves.

Firstly, a brief introduction for those new to the inner workings of task assignment in SQL Server. It is beyond the scope of this article to go into much depth about the internal plumbing of processor task assignment; there are other sources for this. However I hope to give a simplified overview with as few mistakes as possible.

Imagine you have a production server with 8 physical processors. The server is a dedicated box, i.e. the primary and only purpose of the server is to house SQL Server. The architecture is 64-bit on Windows Server 2003/2008 with SQL Server 2005 / 2008 Standard or Enterprise (or indeed Developer) Edition. On your server, under the default settings (no affinity mask set i.e. dynamic mapping of schedulers to processors) you will normally find one scheduler per processor. It is important to note that unless you specify an affinity mask, there is no automatic one-to-one assignment of schedulers to processors, however often the workload may appear that way. Tasks can be assigned to other workers on different schedulers, there is a detailed and complex flow of movement at this layer.

An affinity mask is a binary value representative of the state of each processor as it relates to SQL Server – in essence, whether the processor is ‘turned on’ or ‘turned off’. Having processors unavailable for SQL Server to use may be beneficial in some circumstances, i.e. if you are using the production database server as a web application or Sharepoint server (please don’t do this!).

Processors 0 – 7 on an eight-way server can correspond to a one-byte binary value like 00000000 where each digit of the value references a single processor. Hence, 11111111 (decimal value: 255) means all processors are used for SQL Server. 00100100 (decimal value: 36) means processors 2 and 5 are in use. Affinity masks can come in one, two, three and four-byte forms and in addition, for 64-bit systems with more than 32 CPUs, a secondary ‘Affinity64’ mask can be configured to complement the first mask and extend the range of values.

Below is a simplified diagram of how schedulers map to processors using an affinity mask, and a simplified view of tasks being assigned to workers, which are assigned to schedulers, which are mapped to processors:

(Thanks to www.wpclipart.comfor the gratis CPU component artwork)

With the basics covered, we can now look at whywe would want to monitor the processor use. After all, with today’s multi-core, multi-processor systems, surely high CPU loads are a thing of the past? With today’s NUMA architecture providing extra memory bus capabilities and super-fast, high-efficiency cores, processing bugbears are the least of your worries. Right?

Sadly, wrong. As businesses demand more and more from their applications, the corresponding tasks that the database layer has to complete get larger too. In the era of big data (or should that be Big Data?) it is not unusual to find multi-terabyte databases. Microsoft have 100TB+ databases on record for some of their biggest clients (see the Case Studiessection on the Microsoft site). Imagine computing sums or products of thousands of data points across a meticulously-arranged cube that’s based on a terabyte database or consider how many transactions a site like Amazon gets through every second of every day, and how compute-intensive that will be. CPU time can still be maxed out in any architecture. The effects on SQL Server can be disastrous – under high load, inbound connections can be refused and queries can time out or stall with unintended consequences.

It’s not just the processor use. The schedulers normally are assigned a roughly-equal number of workers. The workers themselves are spawned and destroyed by SQL Server, with each processor allocating and yielding processor time on the fly. SQL Server normally does an excellent job of dynamically managing the processor time per scheduler/worker (known as a ‘quantum’). However, factors like MAXDOP (Maximum Degree of Parallelism), badly-configured settings (Cost Threshold for Parallelism set too low/high), uneven query batches being incorrectly split, good old-fashioned high demand and even impending hardware failure (silicon degradation, for example) can cause an uneven distribution of tasks to worker threads. It’s important to spot this early, so we can:

  • Spot high processor demand in near-real-time and take measures to prevent problems
  • Instantly ‘eyeball’ the data and see if the values are extreme given the processor use history
  • Spot patterns of activity where parallelism is not working efficiently

Using CPU and scheduler metrics should be part of an extensive toolkit and this is not a catch-all solution. However when used in conjunction with the DMVs, your other component tools, monitoring, notifications, alerts etc., this will help you to get a handle on a situation or diagnose a potential problem before it becomes a real one.

To business. Firstly, you will need a copy of Excel. I’m using Office 2010, so the screenshots and descriptions I use you may need to amend for earlier versions or for the open-source equivalents. Secondly, you’ll need a clear path from the machine you’re using Excel on (perhaps your local workstation) to the server. You may need to open firewall ports to allow this to happen. You’ll also need an account with appropriate permissions (public, CONNECT, VIEW SERVER STATE, and preferably DB_OWNER on a diagnostic or sandbox database).

Step 1: Set up the data objects

Issue the following query to find out how many schedulers you have on your target server.

SELECT COUNT(*)
 FROM sys.dm_os_schedulers
 WHERE scheduler_id < 255
-- (ids >=255 are for the DAC or other internal use)

This should correspond to the number of processors you have on your server. Note that if you’re using hyperthreading, you’ll normally have one scheduler per logical processor, rather than physical.

Now check if you’re using an affinity mask. By default, you will not. You can find out by querying sys.configurations. To do this, you’ll need to turn on ‘show advanced options’ first and have the VIEW SERVER STATE permission. Value will be 0 if the affinity mask is unused, otherwise it will be a decimal value corresponding to the binary representation of the processor use mapping, as explained above:

EXEC sp_configure 'show advanced options', 1
RECONFIGURE WITH OVERRIDE
GO
SELECT [value]
 from sys.configurations
 WHERE [name] = 'affinity I/O mask'
GO

On your diagnostic database (I will refer to this as SANDBOX from here on out), create the following tables. These will act as repositories for the data you collect:

-- Create one 'Scheduler_N' table for each scheduler / processor, starting from 0. -- i.e. if you have two processors, create two tables called Scheduler_0 and

-- Scheduler_1.
CREATE TABLE [dbo].[Scheduler_N] (
[UID] [bigint] IDENTITY(1 ,1) NOT NULL,
[timestamp] [datetime] NOT NULL,
[is_idle] [bit] NOT NULL,
[current_tasks_count] [bigint] NOT NULL,
[runnable_tasks_count] [bigint] NOT NULL,
[current_workers_count] [bigint] NOT NULL,
[active_workers_count] [bigint] NOT NULL,
[work_queue_count] [bigint] NOT NULL,
[load_factor] [bigint] NOT NULL 
)

-- This next table will hold general processor usage data:
CREATE TABLE SANDBOX.dbo .OverallProcessorUsage (
 EventTime DATETIME,
 SQLProcessUtilization INT,
 SystemIdle INT,
 OtherProcessUtilization INT 
)

Now create your procedures. The first procedure collates the data we’ll be needing into the first set of tables. Below is an example where you are configuring the procedure for four processors – feel free to amend this to suit your architecture. Note the bitwise switches will be explicitly set to 0 only if you are using an affinity mask and the processor is disabled for SQL Server use.

CREATE PROCEDURE [dbo].[GetSchedulerData] (
 @s0 BIT = 1, 
 @s1 BIT = 1 -- add more here if necessary
)

AS BEGIN

IF @s0 = 1
 BEGIN
  INSERT INTO SANDBOX.dbo.Scheduler_0
   SELECT GETDATE(),
          sch.is_idle,
          sch .current_tasks_count, sch.runnable_tasks_count,
          sch .current_workers_count, sch.active_workers_count,
          sch .work_queue_count,
          sch.load_factor
    FROM sys.dm_os_schedulers sch
    WHERE sch. scheduler_id = 0
 END

IF @s1 = 1 
 BEGIN 
  INSERT INTO SANDBOX.dbo.Scheduler_1
   SELECT GETDATE(),
          sch.is_idle,
          sch.current_tasks_count, sch.runnable_tasks_count,
          sch.current_workers_count, 
          sch.active_workers_count,
          sch.work_queue_count, sch.load_factor
    FROM sys.dm_os_schedulers sch
    WHERE sch. scheduler_id = 1

 END

-- continue if necessary
END

The following procedure was written by Ben NevarezI can take no credit. It uses the largely undocumented DMV sys.dm_os_ring_buffers combined with the CPU ticks column of sys.dm_os_sys_info to correlate CPU use and divide it into idle, SQL Server use, and non-SQL Server use.  You can find the full article here:  http://sqlblog.com/blogs/ben_nevarez/archive/2009/07/26/getting-cpu-utilization-data-from-sql-server.aspx

I’ve modified it slightly to insert the results into the table we made earlier:

CREATE PROCEDURE dbo.GetProcessorUsage 
AS 
BEGIN
 -- Courtesy of Ben Nevarez

DECLARE @ts_now bigint

SELECT @ts_now = cpu_ticks / CONVERT(FLOAT,cpu_ticks_in_ms) FROM sys.dm_os_sys_info

INSERT INTO SANDBOX.dbo .OverallProcessorUsage
 SELECT TOP 1
    dateadd(ms, -1 * (@ts_now - [timestamp]), GETDATE()) AS EventTime,
    SQLProcessUtilization,
    SystemIdle,
    100 - SystemIdle - SQLProcessUtilization AS OtherProcessUtilization
  FROM (
         SELECT
           record.value( '(./Record/@id)[1]', 'int') AS record_id,  
           record.value( '(./Record/SchedulerMonitorEvent/SystemHealth/SystemIdle) [1]','int' ) AS SystemIdle,
           record.value( '(./Record/SchedulerMonitorEvent/SystemHealth/
           ProcessUtilization)[1]' , 'int' ) AS SQLProcessUtilization,
           timestamp

         FROM (
           SELECT timestamp , convert (xml, record) as record
             FROM sys.dm_os_ring_buffers
             WHERE ring_buffer_type = N'RING_BUFFER_SCHEDULER_MONITOR'
             AND record LIKE '%<SystemHealth>%') AS x
          ) AS y
       ORDER BY record_id DESC
END

Now you’ll need to create a login and database user for Excel to use. Alternatively you can use an existing login you’ve already configured.

CREATE LOGIN excel_login WITH PASSWORD = 'In5p3cT0Rg4DG3t';
GO
EXEC sp_addsrvrolemember  
   @rolename = 'db_owner', 
   @loginame='excel_login';
GO
USE SANDBOX
GO
CREATE USER excel_user FROM LOGIN excel_login;
GO
GRANT EXECUTE on dbo.GetSchedulerData TO excel_user;
GRANT EXECUTE on dbo.OverallProcessorUsage TO excel_user;

-- You may wish to:
EXEC sp_addrolemember 
   @rolename = 'db_owner', 
   @membername = 'excel_user';

Finally, we need to set up a job to collect all the stats. Use SQL Server Agent to create a new job. Schedule it weekly, with all days ticked, executing every 1 minute. The screenshots below, using SSMS, should illuminate this procedure. There should be 2 job steps. The first will populate the Scheduler_N tables

The second populates the processor use table.

The schedule is shown below

Note that in SQL Server 2012, you can schedule with a granularity to the second, but in previous versions the smallest unit of time for the purposes of scheduling is a minute, hence the schedule suggested above. Feel free to modify to suit your purposes.

That’s all we need to do SQL Server-side. Make sure your jobs are running by querying the Scheduler_N tables you created – a new row should be added every minute, or according to your modified schedule.

We now need to set up our Excel workbook.

Step 2: Set up the Excel workbook

Now let’s set up the workbook

  1. Open Microsoft Excel 2010, and create a new blank workbook.
  2. Click on the Data tab, and click From Other Sources on the Import sub-tab.
  3. On the drop-down menu, click From SQL Server…
  4. Now in the resulting box, type the address of the server. If it’s local, you can use the TCP loopback interface 127.0.0.1,1433 (where 1433 is your port) providing that a) you are using the default port, b) TCP/IP is enabled on your server (by default, yes). You can also use (local) or localhost if you’re running the SQL Browser service. If not, put in the IP address and port of the server in question.
  5. Next, select the database from the drop-down menu. This will form your data connection. We are using SANDBOX, so I’ll select SANDBOX from the menu and click Next.
  6. In the subsequent window, I’ll select the table I want to query data from. For this sheet, I will select dbo.Scheduler_0. Click Finish.

You will now see that the data has been pulled from the table directly into the spreadsheet.

  1. Repeat Steps 1-6 on a new sheet each time for each scheduler you are collecting data on, selecting each of your dbo.Scheduler_N tables in turn. When you are finished, you will have N sheets with the scheduler data on, partitioned (by sheet) by scheduler. On the data tab, click Refresh then Refresh All… to pull fresh data from the database into your sheets. You will find extra rows added onto all sheets automatically.
  2. Once you’re done importing scheduler data, create a new worksheet in the workbook and import the contents of dbo.OverallProcessorUsage using the same method as in the steps above. Then highlight the timestamp, SQLProcessUtilization and OtherProcessUtilization columns for all values present and create a new line graph. You will need to play with the formatting a little – here, I have the x axis labels turned off, and the graph custom-sized to fit on the same sheet as the source data. NOTE: I have noticed in Office 2010 that if you select the entire column(s) as source data, the graph becomes unreadable, as all blank values are counted. Only select the block of data containing the columns and rows you want. As the workbook is refreshed, the data source for the graph will continually update – you will not have to do this manually).

  1. Now create another new sheet, called Stats. On this page will be a general summary of the stats collected, together with the granular chart data per scheduler.

These values are linked to the latest value for the associated columns in the processor usage sheet. Simply select the data source as the last value of the relevant column. These values will update automatically on refresh.

Times and dates in the figure above indicate the range of data. They come from the MIN and MAX values of the timestamp column in any of the scheduler sheets. Format the cells for DATE and TIME respectively to show the component parts.

Duration is simply a function of MAX – MIN time, measured in HH:MM:SS

Current Idle Schedulers: Calculated as N-(LN+LN+1+LN+2 … LN+N) where N is number of schedulers and LN is latest idle value (Boolean).  E.g. for 8 schedulers where the current row (latest row) on each scheduler sheet is 114, the formula is:

=8-(Scheduler0!C114+Scheduler1!C114+Scheduler2!C114+Scheduler3!C114+Scheduler4!C114+Scheduler5!C114+Scheduler6!C114+Scheduler7!C114)

Total Current Tasks: Calculated as the sum of the current tasks for each scheduler on each sheet. Example formula:

=Scheduler0!D114+Scheduler1!D114+Scheduler2!D114+Scheduler3!D114+Scheduler4!D114+Scheduler5!D114+Scheduler6!D114+Scheduler7!D114

Total Runnable Tasks:  Calculated as the sum of the current runnable tasks for each scheduler on each sheet.  Example:

=Scheduler0!E114+Scheduler1!E114+Scheduler2!E114+Scheduler3!E114+Scheduler4!E114+Scheduler5!E114+Scheduler6!E114+Scheduler7!E114

(Note:  Because of the very low window where each task becomes runnable, i.e. the high relative proportion of time it spends not runnable, this counter will rarely increment).

Total Current Workers: Calculated as the sum of the current workers for each scheduler on each sheet.  Example:

=Scheduler0!F114+Scheduler1!F114+Scheduler2!F114+Scheduler3!F114+Scheduler4!F114+Scheduler5!F114+Scheduler6!F114+Scheduler7!F114

Total Active Workers: Calculated as the sum of the active workers for each scheduler on each sheet.  Example:

=Scheduler0!F114+Scheduler1!F114+Scheduler2!F114+Scheduler3!F114+Scheduler4!F114+Scheduler5!F114+Scheduler6!F114+Scheduler7!F114

(Note: active workers should always be lower than current workers.  Current workers is limited by default to 576, visible in sys.configurations.  This figure can be overridden up to a maximum of 32,768 workers on a 64-bit system.  Default dynamic.)

Average Load Factor: Calculated as the unweighted average of the current load factors for each scheduler, rounded to 1 decimal place.  Example:

=ROUND(AVERAGE(Scheduler0!I114,Scheduler1!I114,Scheduler2!I114,Scheduler3!I114,Scheduler4!I114,Scheduler5!I114,Scheduler6!I114,Scheduler7!I114),1)

Total Work Queue: Calculated as the sum of the current work queues for each scheduler on each sheet.  Example:

=Scheduler0!H114+Scheduler1!H114+Scheduler2!H114+Scheduler3!H114+Scheduler4!H114+Scheduler5!H114+Scheduler6!H114+Scheduler7!H114

Affinity Mask: Uncalculated value indicating whether an affinity mask on the processors (and corresponding AffinityMask64) has been set, or whether it is not used.

On the same sheet:

Zoom in  |  Open in new window

Put one graph for each scheduler.  Each graph is a simple line chart against the columns in each dbo.Scheduler_N sheet, although some formatting is required.

Finally, create one more sheet called Load Pattern and add multiple data series to it – one data series for each Load_Factor column in your dbo.Scheduler_N sheets. You will have one series per scheduler/processor.

The graph is a collection of the series of each Load Factor in each Scheduler_N sheet.  Ensure you specify the exact columns and rows and not a blanket column i.e. J:J otherwise the graph will not display correctly.  The data (and graph) will update on each data refresh.

Below is an example of the sheet. I have added in the duration and range again for easy reference when viewing the sheet.

You should now have a working CPU performance dashboard – congratulations! To refresh the data, either use a macro to do this, or call the refresh directly (AddRefresh method? Untested.) and call it from a Timer component using VB.NET in Excel. I prefer to update my workbook manually with a keyboard shortcut – one press, and everything updates, giving me a near-real-time human-friendly view into what my schedulers are doing.

I hope you enjoyed reading this and that some/all of it comes in useful to you. Please feel free to make comments / corrections and suggestions on this article, I’ll endeavor to respond as soon as I can.

Excel insert date

tiny tipp, but useful 😀

‘control’ + ‘.’ = static today
‘control’ + ‘:’ = dynamic today

that’s all

list tables and/or columns

simple, but always needed 😀

exec sp_tables
exec sp_columns tablename


SELECT
dbo.sysobjects.name AS Tabellenname, dbo.syscolumns.name AS Spaltenname
FROM
dbo.syscolumns INNER JOIN
dbo.sysobjects
ON dbo.syscolumns.id = dbo.sysobjects.id
WHERE
(dbo.sysobjects.xtype =‘U’)